WHAT IT ALL MEANS … I HOPE

I realize that I’ve shelved my news bias measurement project for years. Still, I remain keenly interested in how people develop their political opinions, and what it all means.

The early interest in Donald Trump, Bernie Sanders, and Carly Fiorina, although quite different in their presentations and positions, may have one common thread. People are simply fed up with politics as usual, and politicians who reek of that particular scent.

Having been in high-tech for almost 30 years, I came out of the business school mold of “Blue Suit/White Shirt/Red Tie.” I wore the accepted uniform, and talked the corresponding talk. Then, in (seemingly) one day, these guys from Silicon Valley with torn jeans, worn sandals, dirty T-shirts and genuinely greasy hair — armed with the unshakeable foresight of a 27-year-old zillionaire—- were kickin’ my starched butt. Instantaneously, I represented the old school “in-the-box” plodding way of getting technology to market. The Valley Boys were immediately acknowledged as more creative. Just LOOK at them. Of course they were.

I feel for ya’, Jeb. Hillary. I really do.

I could not compete with the new crowd at first. The Silicon Soothsayers were unbounded by the rules of the businesses as I knew them, particularly in my markets. Surely, they had demonstrated raging success in other areas. Of this I could not argue. But eventually, the hopes they inspired were tempered by the realities of the marketplace. The end result was a slower-yet- significant change that the new wizards instigated, if not led to completion.

Net-net, it was pretty good stuff.

So maybe we don’t elect Carly, Bernie, or even “The Donald.” But my hope is that all of the Presidential candidates go-to-school on them and truly absorb the underlying meaning in the message. I’m not sure politicians, PACs, or even the Koch Brothers can carpet-bomb advertise their way around this phenomenon. In fact, this may be the backlash for all such lavish spending to maintain what is in the end barely the status quo.

Mediate Metrics Update

My sincere apologies to those who have been following my work, but I have come to the conclusion that I must suspend my efforts to measure political bias in the media, at least for the time being. The demands of other life priorities, coupled with the challenges of getting the system to work to my satisfaction, have made this decision necessary.

Despite this unfortunate turn, the effort was highly educational and afforded me certain perspectives on political news bias —- both in how it is delivered and in how it is received — that I will share with readers over the coming days, weeks, and months. Having devoted over 60 hours a week to this task for 6 months, one cannot help but gain a few insights along the way.

Perhaps most interesting (and amusing) was the reaction I received from the blogosphere when my efforts came to light. I have often commented that so-called media “watchdog” groups are all about watching the other dogs, and therefore lose their value for those who simply want a way of handicapping the political information they gather. But the most engaged viewers ARE partisan, and the feedback I received from them suggested that they were not interested in an objective bias metric. This phenomenon parallels the media construct of the day; “slanted” news outlets are far more popular than those which tend towards the middle, particularly in cable news.

Simply put, partisan viewers tend to be engaged and participate like sports fans at a pep rally.

Not surprisingly, some media people aggressively challenged the fundamental value of measuring news bias at all. My favorite comment came from a British journalist, who starkly said that,” I’m not so into the whole impartial journalism ideal. My ideal is fealty to the truth, not to balance.” When I first read that comment, I pictured a court room in which a lawyer imperiously states that, “I don’t have facts or witnesses, but I am uniquely blessed to know the absolute TRUTH!”

Short trial.

In fairness to that commenter, my view of media objectivity is not — nor has it ever been — robotic commentators stating cold facts without passion or perspective. Rather, it is a healthy balance of thoughtful, engaging analysis that fairly presents BOTH sides of key political issues. That, and the fact that I’m an early riser, is probably why I am a fan of MSNBC’s “Morning Joe.” Viewpoints are intelligently and passionately delivered on both sides of any political topic, although the format equally exposes them to raging partisan criticism (especially when Joe Scarborough takes issue with his own). Still, for an independent like me, it’s a great way to hear a passionate, 2-sided discourse and form my own opinion, discounting for MSNBC’s over-arching liberal bias, of course.

One conclusion I could not help but come to is that those most passionate and engaged about their political views want to be affirmed by the media, not informed. Of course, those folks were not the market segment I was trying to reach, but they were the most vocal. The challenge for any media bias rating service like the one I had envisioned was reaching the next tier — those who are going about their busy daily lives, and simply grazing the news for political insights. As I have noted elsewhere, I cannot tell you how many times I have had conversations with uninitiated viewers who proudly state that, “The only news program I watch is the O’Reilly Factor … or Hardball …,” etc.

If such low engagement viewers and voters are acquiring their political insights this way … or from political news sound bites that resonate throughout our society at the speed of light … or from the deluge of Super-Pac ads sponsored by some seemingly high-minded “citizens” group …

… then we all have cause for concern.

Tagged , , , , , , , , , , ,

FLASH REPORT: Political Slant Ratings by Show – 1/30 to 2/3

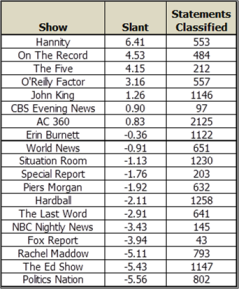
Our latest TV News measurement metrics, targeting individual programs aired by the 3 major broadcast networks (ABC, CBS, and NBC) and the top 3 cable news channels (CNN, Fox News, and MSNBC), is fairly consistent with our previous studies.  As has been our pattern, we have limited our focus shows airing from 5 PM until 11 PM eastern time, Monday through Friday. Because of that, transcript coverage is less than normal since Florida primary coverage preempted several regular programs under study.

It’s worth noting that, particularly in the case of CNN, those special programs garnered Nielsen ratings of roughly twice the average of the programs they replaced (Erin Burnett Outfront & Anderson Cooper 360). For those who wonder why the media is obsessively covering the Republican primaries, your answer lies there.

CHART 1: Slant Rating by Show - January 30 to February 3

As always, content with a numerical rating above zero indicates a Republican slant, with ratings below zero representing a Democratic slant. In this case, however, those shows which are in the +2.0 to -2.0 range are shown in gray, indicating that they are in the “balanced” news category. The one notable exclusion this week is CBS Evening News, but our content coverage for it was exceptionally light. Red remains the color indicator for “slanted” news which favors the Republican party, while slanted content that favors towards the Democratic party is shown in blue. Those interested in the underpinnings of the Mediate Metrics slant rating system should review our January 31st post, or see our primer on Text Analytics Basics at: http://wp.me/p1MQsU-at.

Since our analytical coverage varies by program and date, so does our confidence in the associated show ratings. The exact amount of program coverage is shown in the Table 1 below, but we have graphically indicated depth-of-coverage by way of color shading in Chart 1. For example, the cones representing CBS Evening News, Special Report (Fox), and NBC Nightly News were purposely made lighter to reflect the relatively small transcript coverage for those particular show. We should also note that our version 1.4 classifier did exhibit some anomalies that caused our NBC Nightly News ratings to be disproportionately skewed towards favoring Republicans.

TABLE 1: Slant Rating by Show - January 30 to February 3

Further information about our rating system can be found in previous posts, or by contacting us via email at: barry@mediatemetrics.com

Tagged , , , , , , , , , , , , , , , , , , , , ,

Mediate Metrics FAQ #1

Thanks in large part to coverage initiated by Inside Cable News, interest in our media bias/slant rating system has increased dramatically. Rather than field all questions individually, we’ve decided to post some of the most popular ones below:

How does one measure “bias” in the media without introducing bias into the system?

We were diligent in trying to maintain objectivity by adhering to very strict social science/text analytics, guidelines, working with a partner who is very experienced in this area, and engaging multiple “coders” for the sake of system integrity . After many months of incrementally refining the system — and waiting until we achieved high levels of inter-coder correlation — we released our version 1.0 classifier, and have continued to refine it every day since. Systems like ours must be constantly refined to adapt to the changing political rhetoric of the day. Fortunately, our platform is designed to do just that.

Text classification systems use Natural Language Processing elements —- basically, a progression of statistical correlation techniques —- to mimic the results of expert human coders. That being the case, the human coding process is key, since that is where bias can most readily be introduced. Some of the provisions we included to minimize coder bias include:

  • Defining VERY strict rules for identifying transcript statements which can be coded as either “Favoring Democrats/Critical of Republicans,” or “Favoring Republicans/Critical of Democrats.” For example, the experts can only code for slant if if the explicit terms or specific proxy labels for Democrats or Republicans are contained in the text.
  • Randomizing transcript statements for the human coding process so that “slant inertia” is drastically reduced. Even expert coders tend to bring outside context into their evaluations, especially when reading a narrative which has a repetitive theme. Randomizing statements helps the “man” component of this man-machine partnership to be more clinical, and enhances objectivity.
  • Regular adjudication sessions, in which the team members review their mismatches and recommend rule refinements to improve coding clarity. Having done this innumerable times, and operating under the proviso of, “When in doubt, code NEUTRAL,” I can tell you that bias is controlled rather effectively this way.
  • Partitioning statements related to the Republican Presidential primaries. This was critical to making the ratings fair and reasonable. News coverage about the Republican primaries is decidedly negative, and is often about Republican candidates bashing other Republican candidates, while we specifically target inter-party comparisons. Once again, we have VERY strict guidelines for how we treat this situation.
  • Following slant assessment templates which involve identifying the speaker, determining the object of his/her discussion, assessing inter-party comparison(s),uncovering embedded judgments, and noting factual references that clearly reflect positively-or-negatively towards a particular party.

Hopefully, you get the idea. We’ve gone to great pains to make our ratings objective, but I am not so bold as to represent that it is perfect. Even the best text analytics systems have limitations. This one is no exception.

What is the business model for this service?

Beyond the high-level slant metrics we have initially provided free-of-charge, there is additional business value to be reaped from:

  • Networks, news analysts, and interest groups, through secondary slant studies on specific topics such as health care, labor/union issues, military spending, right-to-life, tax reform, regulatory measures, etc.?
  • Watchdog agencies, via insight reports on the political views of prominent news anchors, correspondents, and contributors?
  • Various political groups desiring a deeper understanding of each network’s Republican Primary coverage and slant.
  • Commercial, governmental, and educational bodies desiring to analyze the resonance of TV News slant through social media platforms like Twitter, Facebook, and the blogosphere.
  • Media outlets, who want to certify that their content meets a specific political/informational criteria, for the purpose of differentiation

Say the President has a bad news day…something bad happens…bad job numbers, court case goes against the administration, scandal in the West Wing…whatever. How does your system handle that scenario?

A bad (or good) day by the President will influence our ratings. Slant ratings effectively “move with the market.” Therefore, our ratings are best viewed as relative measure. Said another way, you would find that certain networks and programs are more slanted than others during a “bad” news week, for Democrats or Republicans, but all will be effected by a dominant political news theme.

How does one evaluate “bias” in content that is, by design, supposed to be opinionated?

From our perspective, Op-Ed news content is absolutely valid, as long as viewers are aware that the content they are watching is indeed that. Frankly, we think that boundary between opinion pieces and straight news is often blurry for the general public. News wonks know the difference intuitively, but we have all experienced instances in which an uninitiated viewer proudly states that, “The only news program I watch is {INSERT YOUR OP-ED PROGRAM OF CHOICE}.” Furthermore, straight news programming often contains a subtle-but-consistent political tilt, despite claims to the contrary.

The fact is that TV news programs, regardless of type, often frame the political discourse of the day, which then translates into voting behavior and government policies that dramatically affect our daily lives. That being the case, don’t you think an object entity should “watch the watchers” in order to serve the greater good?

That may sound pretentious, but I don’t know how else to say it.

If Mediate Metrics had been through a rigorous process of development, which can take several months of hard work, they’d be telling us about it, because it would be a big step forward. The biggest trouble is that the initial degree of inter-annotator agreement, depending on how you define it and measure it, is likely to be spectacularly low, say around 30%.

Actually, our inter-coder reliability reached a peak of over 80% before the 1.0 classifier was released.

Our system had been in development for many months, and the supporting the code book is substantial. Still, there are many different outlets for this service, many of which are not staffed with linguistic/text analysis experts.  Knowing that, and in consideration of our limited resources, we did not publicize all of our details, but they are available with certain concessions to confidentiality.


Tagged , , , , , , , , ,

LIBERAL MEDIA BIAS?: Impact Report #2 Provides the Answer(s)

Is there a liberal bias (or as we prefer to call it, political news slant) in the U.S media? It depends largely on which news content you think matters most.

Based on the data we currently have under analysis, early indications are that the leading broadcast and cable new outlets lean towards the Democratic party. With that said, the recently released Pew Research Center News Interest Index indicates that more people are now turning to cable news for information about the 2012 presidential campaign than to other forms of media. Adjusting for their findings yields an entirely different result.

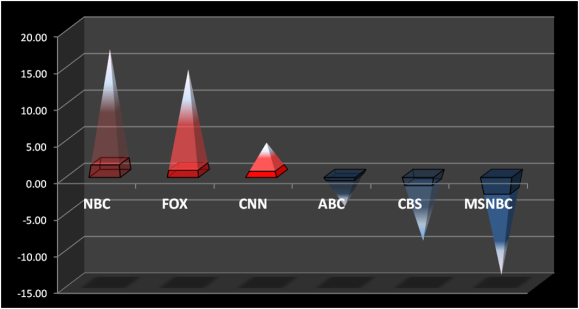
For Impact Report #2,  we have quantified the amount of network slant (aggregate speaker bias plus editorial influence) and combined it with viewership data in order to assess the total “Impact.” In this installment, we have computed the weighted-average Impact Rating for each network during the weeks of January 16th and January 23rd, focused on their evening/weekday news programming. The results are depicted below:

Aggregate Slant Impact: Weekdays - January 16 to 17

Aggregate Slant Impact: Weekdays - January 16 to 27

As in all of our charts, content favoring the Republican party is represented in red (greater than zero), while that which leans towards the Democratic Party is shown in blue (less than zero). We have indicated depth-of-coverage by lightening the base colors as required. For example, the bases representing NBC,CBS, and to a lesser degree Fox News, were purposely made lighter to reflect the limited transcript coverage for those particular networks. Regardless, the basic message depicted in chart above is that the slant rating base is amplified by the number of people viewing the content. The table below shows the numerical analysis supporting the chart:

The Cumulative Slant Ratings  in column 2 were derived from data previously discussed and shown at this site on Wednesday, February 8th. We have also factored in viewership data for the networks and programs under review. As you can see, the cumulative rating for this report — across all networks and programs we are studying —  slightly favors Democrats/Liberals, as indicated by the numbers highlighted in light blue.

If, however, we account for the Pew Research data, which states that 36% of people regularly go to cable networks to learn about Presidential campaigns (and, we presume, national political news in general) versus only 26% turning to national nightly news programs, our cumulative results shift in favor of Republican/conservative interests (as highlighted in light red).

Liberal or conservative media bias? It all depends on whose news one views.

Tagged , , , , , , , , , , , , , , ,

TREND REPORT #1: Political Bias by TV Network

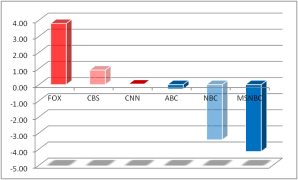
The chart at right summarizes the slant ratings for the networks we have thus far analyzed in January. Our previously published Flash Reports are useful snap shots, but the trend analysis better portrays the long-term political orientation of the networks, programs, and time periods we are studying.

The lines and markers in our graph represent the high/low/weighted average slant ratings for each network in our previous 2 weeks of analysis. Even with this relatively small data set, trends are beginning to emerge.

ABC has operated within a very tight range, as had CNN, indicating that they are quite purposeful about their political orientations — and none too slanted, either.

CBS and (especially) NBC have favored different parties each week, but our analytical databases are the lightest for those 2 networks. Their weighted averages currently favor the Democratic party (depicted in blue. with numerical ratings less than zero), but time will tell where they each level out at.

Not surprisingly, Fox News and MSNBC both show the largest partisan bias. Since Fox’s evening line-up does contain some “balanced” news programming (such as “Special Report with Bret Baier” and “The Fox Report with Shepard Smith”), the fact that their relative weighted slant rating is lower than MSNBC’s comes as no surprise. At some point, we may analyze the balanced news program category by itself to see how political messaging is interwoven within it.

Tomorrow, we will use this data as the basis for our weekly Impact Report to quantify the combined effects of bias and reach. As mentioned in previous posts, bias is not by itself determined by the number of media outlets delivering a slanted message. Rather, it is akin to the advertising concept of share of voice, in which the number of  ad impressions is combined with the total available inventory, as well as the size of the audience that is receiving it.

Tagged , , , , , , , , , , , , , , , ,

FLASH REPORT: Political Slant by Show – 1/23 to 1/27

Building on our previous post, today we our publishing a separate version of our TV news measurement metrics which focuses on the political slant of individual programs aired by the 3 major broadcast networks (ABC, CBS, and NBC) and the top 3 cable news channels (CNN, Fox News, and MSNBC), based on our enhanced 1.2 classifier. The analysis is focused on shows airing from 5 PM until 11 PM eastern time, Monday through Friday.

CHART 2: Slant Rating by Show - January 23 to 27

We’ve constructed this chart slightly differently than in the past. As always, content with a numerical rating above zero indicates a Republican slant, with ratings below zero representing a Democratic slant. In this case, however, those shows which are in the +2.0 to -2.0 range are shown in gray, indicating that they are in the “balanced” news category. The one notable exclusion this week is NBC Nightly News, but our content coverage for it was exceptionally light. Red remains the color indicator for “slanted” news which favors the Republican party, while slanted content that favors towards the Democratic Party is shown in blue. Those interested in the underpinnings of the Mediate Metrics slant rating system should review our January 31st post, or see our primer on Text Analytics Basics at: http://wp.me/p1MQsU-at.

Since our analytical coverage varies by program and date, so does our confidence in the associated show ratings. The exact amount of program coverage is shown in the Table 2 below, but we have graphically indicated depth-of-coverage by way of color shading in Chart 2. For example, the cones representing CBS Evening News, Special Report (Fox), and NBC Nightly News were purposely made lighter to reflect the relatively small transcript coverage for those particular show.

TABLE 2: Political Slant by Show - 1/23 to 27

Further information about our rating system can be found in previous posts, or by contacting us via email at: barry@mediatemetrics.com

Tagged , , , , , , , , , , , , , , , , , , , ,

FLASH REPORT: Media Bias by Network – 1/23 to 1/27

Week 2 of our media bias/slant ratings, based on our new-and-improved version 1.2 classifier,  shows some consistencies and variances from our 1/16 – 20 report of last week.

CHART 1: Slant Ratings by Network - Jan. 23 to 27

NOTE: Net content favoring the Republican Party in Chart 2 is portrayed in red; net content favoring the Democratic Party is shown in blue.

CBS and NBC’s party slant ratings, in comparison to last week’s, actually flipped in both cases. This is not altogether surprising, given that content under analysis for those 2 networks is relatively light, and that the nightly news shows we evaluate for both are “straight” news programs. In contrast, the party alignments of Fox, CNN, ABC, and MSNBC remained consistent, week-to-week.

As noted last Monday, our transcript coverage varies by network, program, and date. Correspondingly, our rating confidence is directly proportional to the amount of transcript text available for classification.The exact amount of coverage per network is shown in the table to the right, but we have graphically indicated depth-of-coverage in Chart 1 by way of color shading. For example, the bars representing the slant ratings for both NBC and CBS were purposely made lighter to reflect the relatively small transcript coverage for those particular networks.

Mediate Metrics’ slant measurement system is currently focused on weekday transcripts from the national nightly news programs on the 3 major broadcast networks (ABC, CBS, and NBC), along with programming aired from 5 PM until 11 PM eastern time on top 3 cable news channels (CNN, Fox, and MSNBC). Compared to last week, coverage under analysis is significantly improved for ABC and NBC, but has decreased for CBS.

For those new to our site, the numerical slant ratings supporting the Chart 1 emanate from a custom text analysis “classifier,” built to extract statements of political slant from TV news transcripts. (For more on the underlying technology, see our post on Text Analytics Basics at: http://wp.me/p1MQsU-at.) We have trained our classifier to interpret political slant quite conservatively, conforming to strict guidelines for the sake of consistency and objectivity. As such, the ratings we present may be perceived as under-reporting the absolute slant of the actual content under review, but the appropriate way to view our ratings is as relative to similar programming.

To properly evaluate editorial content, we have concluded that the Republican presidential primaries and candidates are subject to intense scrutiny. Related news content tends to be disproportionately negative, and often times does not contain a clear inter-party comparison — an element we consider a crucial condition for the proper evaluation of political slant. As such, we have excluded statements about the Republican Presidential primaries and candidates from our slant ratings at this juncture, unless parallel references to the Democratic party are mentioned in parallel.

We’ll publish slant ratings by program for the same January 23 – 27 time period tomorrow.

Tagged , , , , , , , , , , , , , , , , , ,

TV News Political Bias Impact Ratings: January 16 – 20, 2012 (Revised)

Much debate has been devoted to assessing whether there is a liberal or conservative media bias (or as we prefer to call it, political news slant) in the U.S. Most tend to focus on the source of the bias, but our view is somewhat different. At Mediate Metrics, we prefer to quantify the amount of slant (bias plus editorial influence), combined with the quantity of slant recipients, to assess the full impact of media bias.

As presented in our November 15 post, total objectivity and fairness in the news is a virtual impossibility. Still, our hypothesis is that networks will be less biased when their reputation is built upon informing viewers and being an objective resource. In contrast, news outlets which rely on affirming the political preferences of their loyal viewers will have a natural tendency to be more slanted.

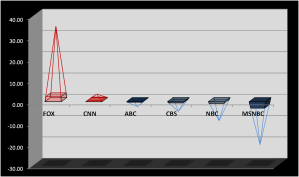
Building on our previous 2 posts, we have added a Political Slant “Impact” Rating comparison for January 16th to the 20th, depicted in Chart 3 below:

CHART 3: Slant Impact Rating - January 16 to 20

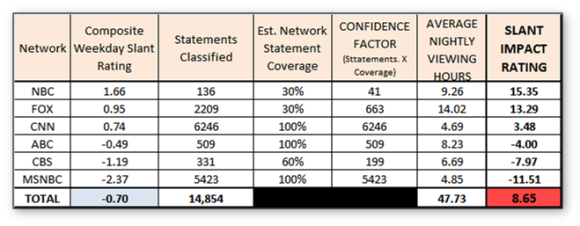
As in our other charts, content favoring the Republican party is represented in red (numerically positive), while that which leans towards the Democratic Party is shown in blue (numerically negative). We have graphically indicated depth-of-coverage, or lack thereof, by lightening those colors. For example, the bars representing NBC,CBS, and to a lesser degree Fox News and ABC, were purposely made lighter to reflect the relatively small transcript coverage for those particular networks. Regardless of coverage, the basic message depicted in Chart 3 is that the slant “foundation”, depicted at the base of each pyramid, is amplified by the number of people viewing the content. Table 3 below shows the numerical analysis supporting the chart:

TABLE 3: Political Slant Impact Measures - January 16 to 20, 2012

The Composite Weekday Slant Ratings in column 2, along with the number of statements classified in column 3, were derived from data previously discussed and shown here on Tuesday, January 31st. Statement coverage and “Confidence Factors” relate directly to the color shades in Chart 3. Most importantly, we have factored in viewership data for the networks and programs under review. This is where things get interesting, given that:

  • The nightly news programs from the major broadcast networks achieve the highest ratings per program by far, but their impact is mitigated by the fact that they are only broadcasted for 30 minutes a night;
  • By definition, the 3 top cable networks broadcast a continuous line-up of news shows, each of which is 60 minutes long, and representing as much as 420 minutes of programming/network for the nightly time period (5 PM to 11 PM) under consideration.
  • Public service programming, such as the Republican Presidential debates, was purposely omitted from our calculations since it does not reflect the editorial views (slant) of the network-or-program they were broadcast on.

Some compelling notions, however preliminary, can be drawn from this analysis. While the aggregate slant of content delivered during this time period appears to favor Democrats (as depicted in light blue in the “Totals” row), the aggregate impact tilts towards the GOP (as shown in the light red cell, same row).

Admittedly, our classifier and database need further refinement, but we think these initial results are rather intriguing. Still, we’d love to know what you think. Don’t hesitate to leave a comment below, or to send one directly to: barry@mediatemetrics.com.

Tagged , , , , , , , , , , , , , ,

TV News Political Slant Report by Show: 1/16 – 1/20

Building on our previous post, today we our publishing a separate version of our TV news measurement metrics which focuses on the political slant of individual programs aired by the 3 major broadcast networks (ABC, CBS, and NBC) and the top 3 cable news channels (CNN, Fox News, and MSNBC), for shows aired from 5 PM until 11 PM eastern time, Monday through Friday. As highlighted yesterday, our analytical coverage varies by network, program, and date, but our intention is to augment it over time.

CHART 2: Slant Rating by Program - January 16 to 20, 2012

Content favoring the Republican party in Chart 2 is portrayed in red (numerically positive), while content that slants towards the Democratic Party is shown in blue (numerically negative). Those interested in the underpinnings of the Mediate Metrics slant rating system should review our January 31st post, or see our primer on Text Analytics Basics at: http://wp.me/p1MQsU-at.

Since our analytical coverage varies by network, program, and date, so does the associated confidence factor in our slant ratings. The exact amount of coverage per network is shown in the Table 2 below, but we have graphically indicated depth-of-coverage by way of color shading in Chart 1. For example, the cones representing The Five, Hannity, and On The Record were purposely made lighter to reflect the relatively small transcript coverage for those particular networks. Low transcript coverage likely accounts for certain results that may seem counter-intuitive; we expect those metrics to adapt with volume and time.

TABLE 2: Slant by Program - January 16 to 20, 2012

As mentioned yesterday, we have partitioned statements about the Republican Presidential primaries, since they tend to be disproportionately negative and often lack inter-party comparison, and have largely excluded them from these slant ratings. Similarly, the Republican Presidential debates and other such dedicated program segments have been omitted in their entirety since they do not reflect the political positions of the networks, programs, or contributors under a consideration.

We’ll publish an “impact rating” for the same January 16 – 20 time period tomorrow.

Tagged , , , , , , , , , , , , , , , , ,