Tag Archives: Bias

LIBERAL MEDIA BIAS?: Impact Report #2 Provides the Answer(s)

Is there a liberal bias (or as we prefer to call it, political news slant) in the U.S media? It depends largely on which news content you think matters most.

Based on the data we currently have under analysis, early indications are that the leading broadcast and cable new outlets lean towards the Democratic party. With that said, the recently released Pew Research Center News Interest Index indicates that more people are now turning to cable news for information about the 2012 presidential campaign than to other forms of media. Adjusting for their findings yields an entirely different result.

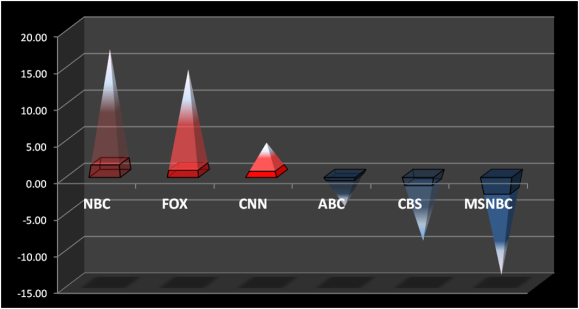
For Impact Report #2,  we have quantified the amount of network slant (aggregate speaker bias plus editorial influence) and combined it with viewership data in order to assess the total “Impact.” In this installment, we have computed the weighted-average Impact Rating for each network during the weeks of January 16th and January 23rd, focused on their evening/weekday news programming. The results are depicted below:

Aggregate Slant Impact: Weekdays - January 16 to 17

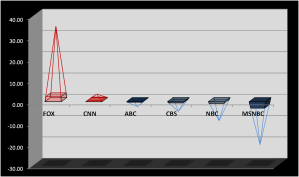
Aggregate Slant Impact: Weekdays - January 16 to 27

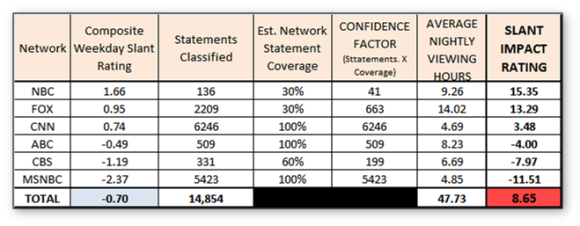
As in all of our charts, content favoring the Republican party is represented in red (greater than zero), while that which leans towards the Democratic Party is shown in blue (less than zero). We have indicated depth-of-coverage by lightening the base colors as required. For example, the bases representing NBC,CBS, and to a lesser degree Fox News, were purposely made lighter to reflect the limited transcript coverage for those particular networks. Regardless, the basic message depicted in chart above is that the slant rating base is amplified by the number of people viewing the content. The table below shows the numerical analysis supporting the chart:

The Cumulative Slant Ratings  in column 2 were derived from data previously discussed and shown at this site on Wednesday, February 8th. We have also factored in viewership data for the networks and programs under review. As you can see, the cumulative rating for this report — across all networks and programs we are studying —  slightly favors Democrats/Liberals, as indicated by the numbers highlighted in light blue.

If, however, we account for the Pew Research data, which states that 36% of people regularly go to cable networks to learn about Presidential campaigns (and, we presume, national political news in general) versus only 26% turning to national nightly news programs, our cumulative results shift in favor of Republican/conservative interests (as highlighted in light red).

Liberal or conservative media bias? It all depends on whose news one views.
Tagged , , , , , , , , , , , , , , ,

TV News Political Bias Impact Ratings: January 16 – 20, 2012 (Revised)

Much debate has been devoted to assessing whether there is a liberal or conservative media bias (or as we prefer to call it, political news slant) in the U.S. Most tend to focus on the source of the bias, but our view is somewhat different. At Mediate Metrics, we prefer to quantify the amount of slant (bias plus editorial influence), combined with the quantity of slant recipients, to assess the full impact of media bias.

As presented in our November 15 post, total objectivity and fairness in the news is a virtual impossibility. Still, our hypothesis is that networks will be less biased when their reputation is built upon informing viewers and being an objective resource. In contrast, news outlets which rely on affirming the political preferences of their loyal viewers will have a natural tendency to be more slanted.

Building on our previous 2 posts, we have added a Political Slant “Impact” Rating comparison for January 16th to the 20th, depicted in Chart 3 below:

CHART 3: Slant Impact Rating - January 16 to 20

As in our other charts, content favoring the Republican party is represented in red (numerically positive), while that which leans towards the Democratic Party is shown in blue (numerically negative). We have graphically indicated depth-of-coverage, or lack thereof, by lightening those colors. For example, the bars representing NBC,CBS, and to a lesser degree Fox News and ABC, were purposely made lighter to reflect the relatively small transcript coverage for those particular networks. Regardless of coverage, the basic message depicted in Chart 3 is that the slant “foundation”, depicted at the base of each pyramid, is amplified by the number of people viewing the content. Table 3 below shows the numerical analysis supporting the chart:

TABLE 3: Political Slant Impact Measures - January 16 to 20, 2012

The Composite Weekday Slant Ratings in column 2, along with the number of statements classified in column 3, were derived from data previously discussed and shown here on Tuesday, January 31st. Statement coverage and “Confidence Factors” relate directly to the color shades in Chart 3. Most importantly, we have factored in viewership data for the networks and programs under review. This is where things get interesting, given that:

  • The nightly news programs from the major broadcast networks achieve the highest ratings per program by far, but their impact is mitigated by the fact that they are only broadcasted for 30 minutes a night;
  • By definition, the 3 top cable networks broadcast a continuous line-up of news shows, each of which is 60 minutes long, and representing as much as 420 minutes of programming/network for the nightly time period (5 PM to 11 PM) under consideration.
  • Public service programming, such as the Republican Presidential debates, was purposely omitted from our calculations since it does not reflect the editorial views (slant) of the network-or-program they were broadcast on.

Some compelling notions, however preliminary, can be drawn from this analysis. While the aggregate slant of content delivered during this time period appears to favor Democrats (as depicted in light blue in the “Totals” row), the aggregate impact tilts towards the GOP (as shown in the light red cell, same row).

Admittedly, our classifier and database need further refinement, but we think these initial results are rather intriguing. Still, we’d love to know what you think. Don’t hesitate to leave a comment below, or to send one directly to: barry@mediatemetrics.com.

Tagged , , , , , , , , , , , , , ,

TV News Political Slant Report by Show: 1/16 – 1/20

Building on our previous post, today we our publishing a separate version of our TV news measurement metrics which focuses on the political slant of individual programs aired by the 3 major broadcast networks (ABC, CBS, and NBC) and the top 3 cable news channels (CNN, Fox News, and MSNBC), for shows aired from 5 PM until 11 PM eastern time, Monday through Friday. As highlighted yesterday, our analytical coverage varies by network, program, and date, but our intention is to augment it over time.

CHART 2: Slant Rating by Program - January 16 to 20, 2012

Content favoring the Republican party in Chart 2 is portrayed in red (numerically positive), while content that slants towards the Democratic Party is shown in blue (numerically negative). Those interested in the underpinnings of the Mediate Metrics slant rating system should review our January 31st post, or see our primer on Text Analytics Basics at: http://wp.me/p1MQsU-at.

Since our analytical coverage varies by network, program, and date, so does the associated confidence factor in our slant ratings. The exact amount of coverage per network is shown in the Table 2 below, but we have graphically indicated depth-of-coverage by way of color shading in Chart 1. For example, the cones representing The Five, Hannity, and On The Record were purposely made lighter to reflect the relatively small transcript coverage for those particular networks. Low transcript coverage likely accounts for certain results that may seem counter-intuitive; we expect those metrics to adapt with volume and time.

TABLE 2: Slant by Program - January 16 to 20, 2012

As mentioned yesterday, we have partitioned statements about the Republican Presidential primaries, since they tend to be disproportionately negative and often lack inter-party comparison, and have largely excluded them from these slant ratings. Similarly, the Republican Presidential debates and other such dedicated program segments have been omitted in their entirety since they do not reflect the political positions of the networks, programs, or contributors under a consideration.

We’ll publish an “impact rating” for the same January 16 – 20 time period tomorrow.

Tagged , , , , , , , , , , , , , , , , ,

TV News Political Slant Report by Network: 1/16 – 1/20

Welcome to the Mediate Metrics inaugural TV news political slant measurement report, based on our version 1.0 text classifier.

To our knowledge, this is the first objective TV news slant rating service ever published. Slant, by our definition, is news containing an embedded statement of bias (opinion) OR an element of editorial influence (factual content that reflects positively or negatively on a particular U.S. political party). This initial report focuses specifically on evaluating  slant contained in the weekday transcripts of  the national nightly news programs on the 3 major broadcast networks (ABC, CBS, and NBC) , as well as programming aired from 5 PM until 11 PM eastern time on top 3 cable news channels (CNN, Fox, and MSNBC). At this stage, analytical coverage varies by network, program, and date, but our intention is to fill in the blanks over time.

CHART 1: Slant by Network - January 16 to January 20, 2012

In keeping with U.S. political tradition, content favoring the Republican party in Chart 1 is portrayed in red (positive numbers), while content that tilts towards the Democratic Party is shown in blue (negative numbers)

To grossly over-simplify, the numerical slant ratings supporting the Chart 1 emanate from a custom text analysis “classifier,” built to extract statements of political slant from TV news transcripts. (For more on the underlying technology, see our post on Text Analytics Basics at http://wp.me/p1MQsU-at.) We have trained our classifier to interpret slant quite conservatively, conforming to strict guidelines for the sake of consistency and objectivity. As such, the ratings we present may be perceived as under-reporting the absolute slant of the actual content under review, but the appropriate way to view our ratings is as relative to similar programming.

As mentioned, our analytical coverage varies by network, program, and date. Correspondingly, our rating confidence is directly proportional to the amount of transcript text available for classification.The exact amount of coverage per network is shown in the table to the right, but we have graphically indicated depth-of-coverage in Chart 1 by way of color shading. For example, the bars representing the slant ratings for both NBC and CBS were purposely made lighter to reflect the relatively small transcript coverage for those particular networks.

During development, we determined that the Republican presidential primaries are an enterprise for which scrutiny is a normal-and-valuable part of the vetting process.  Related news content, however, tends to be disproportionately negative, and often times does not contain a clear inter-party comparison — an element we view as a crucial condition for the evaluation of political slant. With those factors mind, we have partitioned statements about the Republican Presidential primaries, and have excluded them from most slant ratings at this juncture. Similarly, the Republican Presidential debates and other such dedicated program segments have been excluded in their entirety from classification since they do not reflect the political positions of the networks, programs, or contributors under a consideration.

We’ll publish slant ratings by program for the same January 16 – 20 time period tomorrow.

Tagged , , , , , , , , , , ,

Editorial Selection: Fox and MSNBC

Building on the theme of editorial selection and the news, I decided to once again use my “tag cloud” (most popular words) tool on evening and prime time broadcasts from Fox News and MSNBC on November 14th and 15th. As I highlighted yesterday, media outlets can broadcast but a tiny portion of the available news, so I decided to see what these 2 competitors decided to emphasize.

DISCLAIMER #1: I could not wait to get this out, so I’m sure I will be making additional edits and refinements.

DISCLAIMER #2: Tag clouds are not surgical instruments. That fact, combined with the knowledge that I manually culled words that did not directly relate to specific topics and messaging themes should tell the reader to view the following with a critical eye…. as you should with all interpretative journalism.

Which virtually all political news is.

Disclaimers aside, examining the content selection of Fox and MSNBC is like having box seats at a gun fight. It’s clear that MSNBC is putting Republican Presidential candidates under a microscope, taking pot shots at local Republican candidates whenever possible, and positioning themselves as the mouth-piece for the middle class. Similarly, Fox has President Obama and the 2012 election in the cross hairs, featuring topics that cast him or his administration in a negative light, with specific emphasis on job creation (or a lack thereof).

Those are the highlights — or low-lights, depending on your point of view — but there is more information in the clouds if you are willing to stare at them briefly …

**********************************************************************************************************************

MSNBC “TOP 25” TAG CLOUD:

  • Substantial Republican Primary/Candidate focus, with Herman CAIN (236 occurrences) still drawing the most attention, ROMNEY (82 occurrences) a distant second, and Perry (52 occurrences) in third.
  • Occupy Wall Street is a significant topic, as evidenced by the occurrence of the related tag words MOVEMENT, OCCUPY, and STREET. Why WALL did not make the top 25, I have no idea.
  • SCOTT is in the top 25 primarily due to parallel references to Republican governors Scott Walker (Wisconsin) and Scott Brown (Florida). Similarly, JOHN was also mentioned frequently in relation to Ohio governor John Kasich, but I removed that name because several other JOHNs were intermingled in the word count.
  • Frequent references to AMERICANS (and AMERICANS by default, since my tag cloud tool intermittently extracts root words in parallel) and the middle CLASS seems to represent a positioning theme for MSNBC
  • JUDGE generally shows up in 2 different contexts: 1.) The judge who let Penn State coach Sandusky out on reduced bail and; 2.) The impartiality Judges Scalia and Thomas related to the Supreme Court case on health care.
  • CASE shows up in several different contexts, again related to the tag cloud tools penchant to extract root words — ObamaCARE, HealthCARE, MediCARE, and are “they” sCAREd?

FOX “TOP 25” TAG CLOUD:

  • No references to the Republican Primary candidates by name in the Top 25 tag words. In contrast, PRESIDENT (65 occurrences) and OBAMA (42 occurrences) are the top 2 most popular tag words in the cloud. When viewed in relation to the MSNBC tag cloud, one cannot help but conclude that negative politics extends to these 2 networks.
  • Similar, but not exactly the same, thematic positioning around AMERICA, but not so much on CLASS.
  • BOOK was an area of focus mostly because of controversies surrounding Bill O’Reilly’s new book (“Killing Lincoln”), and Peter Schweizer’s book about alleged congressional insider trading.
  • A greater focus on activities in the SUPER COMMITTEE, and with question on whether a satisfactory DEAL can be made.
  • DEAL was also used in the context of favorable (and ethically questionable) deals made on IPOs and land, leveraging the insider trading immunity afforded to congressman.
  • CONGRESS was primarily used in 2 contexts: 1.) There were several CONGRESS persons on the prime time Fox News programs I analyzed, and; 2.) Numerable references were made along the lines of our “Do-nothing CONGRESS. ..”
  • ELECTION appeared primarily as part of 2 topics: 1.) Forward-looking statements related to the 2012 Presidential election, and; 2.) The fact that negative news related to Solyndra was allegedly throttled by administration officials.
  • FLORIDA made the top 25 based on Florida government officials on the shows whose transcripts I analyzed.
  • JOB and JOBS are in the top group because of a focus on the subject of job creation.
  • LEGAL is attached to either the constitutional rights that should or should not be afforded terrorists, as well as related to immigration issues.
  • The term SPEAKER rose to the top because of references and sound bites from House Speaker John Boehmer, as well as an interview with FORMER SPEAKER of the House Newt Gingrich.

**********************************************************************************************************************

If you would like to know more about the specific details of my process or the specific programs I included in this analysis, just email me at: barry@mediatemetrics.com.

Tagged , , , , , , , , , , , , , , , , , , , , , , ,

White Paper Excerpt: “Bias and Objectivity in the News Media”

I remain convinced that one can measure media bias electronically, at least to some extent, by examining the text of news broadcasts and objectively identifying the speaker’s personal value judgments. With that said, it is far more difficult to extract bias based on that content that is chosen to be aired. The following excerpt, taken from a 2004 white paper published by The Foundation for Critical Thinking titled, “How to Detect Media Bias and Propaganda” by Dr. Richard Paul and Dr. Linda Elder, explains this far more eloquently than I ever could.

Enjoy.

********************************************************************************************************************

The logic of constructing news stories is parallel to the logic of writing history. In both cases, for events covered, there is both a massive background of facts and a highly restricted amount of space to devote to those facts. The result in both cases is the same: 99.99999% of the “facts” are never mentioned at all (see Figure 1).

FIGURE 1

If objectivity or fairness in the construction of news stories is thought of as equivalent to presenting all the facts and only the facts (“All the news that’s fit to print”), objectivity and fairness is an illusion. No human knows more than a small percentage of the facts and it is not possible to present all the facts (even if one did know them). It isn’t even possible to present all the important facts, for many criteria compete for determining what is “important.” We must therefore always ask, “What has been left out of this article?” “What would I think if different facts had been highlighted here?” “What if this article had been written by those who hold a point of view opposite to the one embedded in the story as told?”

*****************************************************************************************************************
Amen.

Tagged , , , , , , , , , , , , , , , , , , , , , , , , , , ,

Who’s News? YOU Decide.

The more I study media bias, the more I realize that TV coverage flows (and often overflows) in certain directions because viewers vote with their eyeballs.

The blogosphere is crackling today with reports on the CBS internal memo which directed their debate moderators to devote fewer questions to Michelle Bachmann. The issue certainly has ignited the fanaterati. Don’t get me wrong; editorial selection bias is a very real phenomenon. Still, a thinking person should consider other possibilities.

So here is one: Perhaps we get a disproportionate amount of coverage on certain issues and people because they drive viewership. Combined with the extensive amount of news capacity that needs to be filled, media outlets are motivated to keep popular stories alive because lots of people are following them. As an unfortunate by-product, reporters and commentators fan the  flames over time by digging up all kinds of corner-cases, then sensationalizing them as “New Developments!” And that’s when we enter the realm of the absurd.

Circling back to the issue du jour, giving Michelle Bachmann more debate time does not make sense for the network in that context. It’s an inexact science, but it is a network executive’s job is to promote viewership … which drives ad revenue …which increases company profits, equity value, and personal paychecks.

It’s tempting to see a conspiracy here, and maybe there is one, but I think it is equally possible that this is just capitalism in action.

Tagged , , , , , , , , , , , , , , , , , , , , , ,

Political News: More Commonly Used Media Bias Techniques

Combing through news transcripts for bias indicators provides you with either unique insights or temporary insanity. Despite my questionable mental state, I’ve uncovered some subtler tricks-of-the-news-trade that I’d like to share with my readers.

Value Judgments: By definition, a value judgment is an assessment that reveals more about the values of the person making the assessment than about the reality of what is assessed. Value judgments can be either direct or projected.

Direct value judgments are often preceded with “I,” either explicitly or as understood. Examples are: “I don’t believe that …,” “that won’t work …” Projected value judgments are less obvious, but are used extensively by certain commentators and politicians. Speakers, often wrapping themselves in the flag or as the spokesperson for some popular group, stealthily project their personal opinions with statements like, “Americans won’t support…,”or  “People are not going to …” It doesn’t jump out at you, but the speaker is putting their view in someone else’s mouth.

Loaded Questions and Leading Questions:  A program anchor is in a position of power to determining how the news is presented while viewers sit passively, accepting that the commentator is objectively informing and moderating discussions based on years of conditioning. In the modern era of news programming that is often not the case. Dialogs are rife with loaded and leading questions.

The popular definition of a loaded question is one which contains as controversial assumption but, for the purposes of semantically evaluating bias, my definition is that it is one that contains indisputable evidence of bias. It gives a strong indication of how an anchor wants his/her respondent to answer. Guidelines for recognizing loaded questions include:

  • Embedded value-judgments by the questioner: “Don’t you think that sounds <odd/wrong/funny/strange>”?
  • Multiple questions within the same statement: “Who would support…?”, “What is the thinking….?”, “Where did they get…?”, “When …?”, “Why …?”

Leading questions are usually more subtle, and don’t have the clear indicators of loaded questions. Still, a savvy viewer can generally pick them out instinctively, particularly when considered together with succeeding responses. For the most part, news programs conform to the cardinal rule of litigation: Don’t ask a question if you don’t know how it will be answered. In the information age, commentators are rarely uninformed about the positions of their guests. In fact, most of them are regulars.

Once you are aware of these rhetorical devices, you’ll be surprised how often you will notice them while watching, “The News.”

Tagged , , , , , , , , , , , , , , , ,

RAZING CAIN: Analysis of Prime Time Cable Coverage on Herman’s Sexual Harassment Saga

Using available transcripts (10/31 – 11/1) from  and my tag cloud tool, I compared the prime time coverage differences between CNN, Fox, and MSNBC.  I readily admit that tag clouds are a coarse analytical tool, but some interesting themes  emerge, nonetheless.

Across the board, I removed proper names of network news personalities, and terms that conveyed no significant meaning. In doing so, I was as consistent as possible across all 3 transcripts; my intent was to extract thematic meaning from the accompanying tag clouds. A full list of the words removed from the respective transcripts is available upon request.

CNN

  • Tag cloud indicates in-depth coverage on Cain’s SEXUAL (45 occurrences) harassment issue.
  • Had Politco’s John Martin on show, who helped break the story.
  • Much more scrutiny on the AGREEMENT (42 occurrences) and SETTLEMENT (37 occurrences) than other networks.
  • CAIN (269 occurrences) coverage dwarfs other topics, particularly if one considers all the related terms in the tag cloud. The related terms of PRESIDENT (61 occurrences) and OBAMA (46 occurrences) are the only other major discussion topics of note.
  •  Word count – 34,889

FOX

  • BLACK (23 occurrences) is somewhat overstated because of the interviews with former Secretary of State Condoleeza Rice, but most mentions relate to Herman Cain being a black conservative.
  • Use of DON’T is somewhat conspicuous (123 occurrences). Lots of “I don’t think they …” and “don’t you believe that ..”
  • PRESIDENT (86 occurrences) and OBAMA (56 occurrences) still a major news focus. General distribution of topics discussed, beyond the Cain sexual harassment issue, appears more diverse than CNN’s in this time period.
  •  Word count – 34,644

MSNBC

  • MSNBC’s analysis is skewed towards 10/31. For some reason, they only posted 1 transcript (Politics Nation) on their 11/1 shows.
  •  Based on the 25 most popular tag words included in the cloud, their coverage of the core issues is similar to Fox’s and CNN’s. Still, it’s hard to tell if the limited 11/1 transcript coverage made a difference.
  •  Politics Nation is represented twice in this sample, and that show highlighted the Republican Congressional resolution reaffirming “In God We Trust” (GOD – 50 occurrences), and on the Republican Congressional initiative to cut food stamp subsidies (FOOD – 42 occurrences).
  •  Like Fox, the use of DON’T (169 occurrences) is conspicuously prominent. (“I don’t find” … “we don’t have time” …”maybe they don’t …”)
  • Raw word count of PRESIDENT (92 occurrences) and OBAMA (61 occurrences) is on par with Fox, but the total word count of the MSNBC transcripts is ~ 29% higher than the other 2 networks.
  •  Word count – 45,611
Tagged , , , , , , , , , , , , , , , , , , , , , , , , , ,

FOX and MSNBC News: Messages in the Clouds

FOX and MSNBC News: Messages in the Clouds

As a follow-up to yesterday’s blog post, I have color-coded related words in the tag clouds built from recent Fox and MSNBC news transcripts. At first glance, certain words seemed obviously related in terms of the topics and message points referenced. Further scrutiny taught me that some of the tag word connections to be weak or non-existent, demonstrating the danger of using tag cloud analysis too liberally. Still, I found common themes and clear distinctions between these popular interpretive news outlets.

My analysis is as follows:

Fox News

  • REPUBLICAN, PRESIDENTIAL, CAMPAIGN, and PRIMARIES – Clearly, the Republican Presidential primaries are a topic of import and interest. As such, they are worthy of extensive coverage by any objective standard.
  • Clusivity.” In linguistics, clusivity is a distinction between inclusive and exclusive first-person pronouns. My slightly-altered definition includes any pronouns that indicate that one group is favored, and another is viewed with disfavor. It also encompasses “pronoun putdowns” — instances where a person of well-known rank and title (such as “The President”) is referred to simply as HE. In general, I viewed this as creating a subtle form of clusivity. In the Fox aggregate transcript, HE’S occurred 164 times, and often referred to President Obama or some other member of the Democratic Party. THEY’RE appeared as a more general reference to the Democratic party.
  • OBAMA/OBAMA’S/PRESIDENT/WASHINGTON – When not attributed to a direct quote or video clip from the President, these terms were often used in the same context as HE’S or THEY’RE. In this, as well as the clusivity category mentioned above, it was particularly telling when the show’s anchor uses this type of reference.
  • PEOPLE occurred 236 times, and was used in many contexts. As a tag word indication of thematic emphasis, it should probably be removed from the cloud.
  •  DON’T (261 occurrences). DOESN’T (67 Occurrences), and ISN’T (33 occurrences) – Scanning the transcripts, you see these kind of “not” words used in 2 distinct contexts: 1.) Distancing – “I don’t know …” or “We don’t believe …” and; 2.) Negative labeling – “They don’t <something accusatory>. As I reviewed the transcripts, it appeared that “they” and “don’t” often appeared together in the same statement. In fairness, though, that connection is worthy of systematic analysis.

MSNBC

  • Republican campaign coverage was substantial, as indicated by the extensive occurrence of terms like PRESIDENTIAL, CANDIDATE, CAIN, PERRY, and ROMNEY.
  • Evidence of clusivity was more subtle and complex, but present nonetheless. MSNBC’s version was wrapped around the terms AMERICA (150 occurrences), AMERICAN (250 occurrences), AMERICANS (158 occurrences), and to a lesser degree MIDDLE (98 occurrences) and CLASS (123 occurrences). I don’t claim to be a trained linguist, but the visual association that the tag cloud suggests is that MSNBC represents the best interests of: a.) America; b.) middle-class Americans, and; c.) the American way of life.
    •  Related to MSNBC’s clusivity messaging, there was an undercurrent of RICH (93 occurrences) being used as a negative. Scanning the transcripts, I repeatedly came across statements like, “Republicans favor the rich” and “the rich get richer.” Similarly, terms like TAX and TAXES (216 and 100 occurrences respectively) also seemed to be part of MSNBC’s clusivity strategy. Like Fox’s use of HE’S and THEY’RE, MSNBC’s thematic position appears to be, “Those Republicans favor the rich, and their tax situation is better than ours.”
    • Like the use of WASHINGTON by Fox, MSNBC’s use of HOUSE (83 occurrences) was generally used as a reference to the Republican-led House of Representatives, and was often wielded in a less-than-positive manner.
    • DON’T and DOESN’T were both regularly used for distancing and negative labeling, similar to how they were used by Fox.

    Not to beat this horse into glue, but I’m planning to add one more tag word blog post that removes words that are common to both clouds, and portrays the remaining top 50 terms that are unique to each channel. Like all of these exercises, the output is both subtle and revealing

Tagged , , , , , , , , , ,