Tag Archives: NBC

FLASH REPORT: Political Slant Ratings by Show – 1/30 to 2/3

Our latest TV News measurement metrics, targeting individual programs aired by the 3 major broadcast networks (ABC, CBS, and NBC) and the top 3 cable news channels (CNN, Fox News, and MSNBC), is fairly consistent with our previous studies.  As has been our pattern, we have limited our focus shows airing from 5 PM until 11 PM eastern time, Monday through Friday. Because of that, transcript coverage is less than normal since Florida primary coverage preempted several regular programs under study.

It’s worth noting that, particularly in the case of CNN, those special programs garnered Nielsen ratings of roughly twice the average of the programs they replaced (Erin Burnett Outfront & Anderson Cooper 360). For those who wonder why the media is obsessively covering the Republican primaries, your answer lies there.

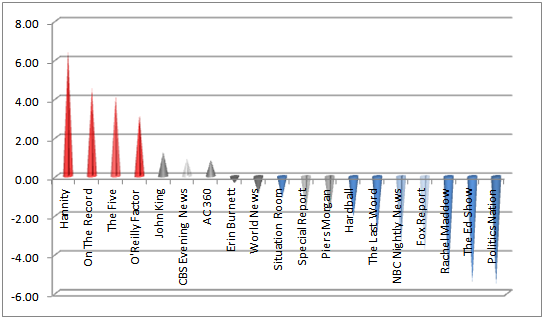
CHART 1: Slant Rating by Show - January 30 to February 3

As always, content with a numerical rating above zero indicates a Republican slant, with ratings below zero representing a Democratic slant. In this case, however, those shows which are in the +2.0 to -2.0 range are shown in gray, indicating that they are in the “balanced” news category. The one notable exclusion this week is CBS Evening News, but our content coverage for it was exceptionally light. Red remains the color indicator for “slanted” news which favors the Republican party, while slanted content that favors towards the Democratic party is shown in blue. Those interested in the underpinnings of the Mediate Metrics slant rating system should review our January 31st post, or see our primer on Text Analytics Basics at: http://wp.me/p1MQsU-at.

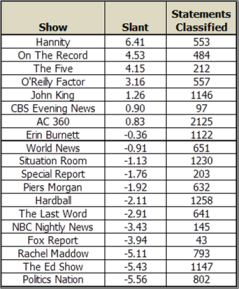
Since our analytical coverage varies by program and date, so does our confidence in the associated show ratings. The exact amount of program coverage is shown in the Table 1 below, but we have graphically indicated depth-of-coverage by way of color shading in Chart 1. For example, the cones representing CBS Evening News, Special Report (Fox), and NBC Nightly News were purposely made lighter to reflect the relatively small transcript coverage for those particular show. We should also note that our version 1.4 classifier did exhibit some anomalies that caused our NBC Nightly News ratings to be disproportionately skewed towards favoring Republicans.

TABLE 1: Slant Rating by Show - January 30 to February 3

Further information about our rating system can be found in previous posts, or by contacting us via email at: barry@mediatemetrics.com

Tagged , , , , , , , , , , , , , , , , , , , , ,

TREND REPORT #1: Political Bias by TV Network

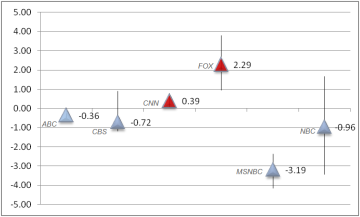
The chart at right summarizes the slant ratings for the networks we have thus far analyzed in January. Our previously published Flash Reports are useful snap shots, but the trend analysis better portrays the long-term political orientation of the networks, programs, and time periods we are studying.

The lines and markers in our graph represent the high/low/weighted average slant ratings for each network in our previous 2 weeks of analysis. Even with this relatively small data set, trends are beginning to emerge.

ABC has operated within a very tight range, as had CNN, indicating that they are quite purposeful about their political orientations — and none too slanted, either.

CBS and (especially) NBC have favored different parties each week, but our analytical databases are the lightest for those 2 networks. Their weighted averages currently favor the Democratic party (depicted in blue. with numerical ratings less than zero), but time will tell where they each level out at.

Not surprisingly, Fox News and MSNBC both show the largest partisan bias. Since Fox’s evening line-up does contain some “balanced” news programming (such as “Special Report with Bret Baier” and “The Fox Report with Shepard Smith”), the fact that their relative weighted slant rating is lower than MSNBC’s comes as no surprise. At some point, we may analyze the balanced news program category by itself to see how political messaging is interwoven within it.

Tomorrow, we will use this data as the basis for our weekly Impact Report to quantify the combined effects of bias and reach. As mentioned in previous posts, bias is not by itself determined by the number of media outlets delivering a slanted message. Rather, it is akin to the advertising concept of share of voice, in which the number of  ad impressions is combined with the total available inventory, as well as the size of the audience that is receiving it.

Tagged , , , , , , , , , , , , , , , ,

FLASH REPORT: Political Slant by Show – 1/23 to 1/27

Building on our previous post, today we our publishing a separate version of our TV news measurement metrics which focuses on the political slant of individual programs aired by the 3 major broadcast networks (ABC, CBS, and NBC) and the top 3 cable news channels (CNN, Fox News, and MSNBC), based on our enhanced 1.2 classifier. The analysis is focused on shows airing from 5 PM until 11 PM eastern time, Monday through Friday.

CHART 2: Slant Rating by Show - January 23 to 27

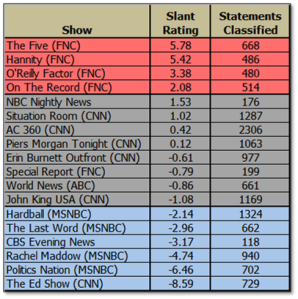
We’ve constructed this chart slightly differently than in the past. As always, content with a numerical rating above zero indicates a Republican slant, with ratings below zero representing a Democratic slant. In this case, however, those shows which are in the +2.0 to -2.0 range are shown in gray, indicating that they are in the “balanced” news category. The one notable exclusion this week is NBC Nightly News, but our content coverage for it was exceptionally light. Red remains the color indicator for “slanted” news which favors the Republican party, while slanted content that favors towards the Democratic Party is shown in blue. Those interested in the underpinnings of the Mediate Metrics slant rating system should review our January 31st post, or see our primer on Text Analytics Basics at: http://wp.me/p1MQsU-at.

Since our analytical coverage varies by program and date, so does our confidence in the associated show ratings. The exact amount of program coverage is shown in the Table 2 below, but we have graphically indicated depth-of-coverage by way of color shading in Chart 2. For example, the cones representing CBS Evening News, Special Report (Fox), and NBC Nightly News were purposely made lighter to reflect the relatively small transcript coverage for those particular show.

TABLE 2: Political Slant by Show - 1/23 to 27

Further information about our rating system can be found in previous posts, or by contacting us via email at: barry@mediatemetrics.com
Tagged , , , , , , , , , , , , , , , , , , , ,

FLASH REPORT: Media Bias by Network – 1/23 to 1/27

Week 2 of our media bias/slant ratings, based on our new-and-improved version 1.2 classifier,  shows some consistencies and variances from our 1/16 – 20 report of last week.

CHART 1: Slant Ratings by Network - Jan. 23 to 27

NOTE: Net content favoring the Republican Party in Chart 2 is portrayed in red; net content favoring the Democratic Party is shown in blue.

CBS and NBC’s party slant ratings, in comparison to last week’s, actually flipped in both cases. This is not altogether surprising, given that content under analysis for those 2 networks is relatively light, and that the nightly news shows we evaluate for both are “straight” news programs. In contrast, the party alignments of Fox, CNN, ABC, and MSNBC remained consistent, week-to-week.

As noted last Monday, our transcript coverage varies by network, program, and date. Correspondingly, our rating confidence is directly proportional to the amount of transcript text available for classification.The exact amount of coverage per network is shown in the table to the right, but we have graphically indicated depth-of-coverage in Chart 1 by way of color shading. For example, the bars representing the slant ratings for both NBC and CBS were purposely made lighter to reflect the relatively small transcript coverage for those particular networks.

Mediate Metrics’ slant measurement system is currently focused on weekday transcripts from the national nightly news programs on the 3 major broadcast networks (ABC, CBS, and NBC), along with programming aired from 5 PM until 11 PM eastern time on top 3 cable news channels (CNN, Fox, and MSNBC). Compared to last week, coverage under analysis is significantly improved for ABC and NBC, but has decreased for CBS.

For those new to our site, the numerical slant ratings supporting the Chart 1 emanate from a custom text analysis “classifier,” built to extract statements of political slant from TV news transcripts. (For more on the underlying technology, see our post on Text Analytics Basics at: http://wp.me/p1MQsU-at.) We have trained our classifier to interpret political slant quite conservatively, conforming to strict guidelines for the sake of consistency and objectivity. As such, the ratings we present may be perceived as under-reporting the absolute slant of the actual content under review, but the appropriate way to view our ratings is as relative to similar programming.

To properly evaluate editorial content, we have concluded that the Republican presidential primaries and candidates are subject to intense scrutiny. Related news content tends to be disproportionately negative, and often times does not contain a clear inter-party comparison — an element we consider a crucial condition for the proper evaluation of political slant. As such, we have excluded statements about the Republican Presidential primaries and candidates from our slant ratings at this juncture, unless parallel references to the Democratic party are mentioned in parallel.

We’ll publish slant ratings by program for the same January 23 – 27 time period tomorrow.

Tagged , , , , , , , , , , , , , , , , , ,

TV News Political Slant Report by Show: 1/16 – 1/20

Building on our previous post, today we our publishing a separate version of our TV news measurement metrics which focuses on the political slant of individual programs aired by the 3 major broadcast networks (ABC, CBS, and NBC) and the top 3 cable news channels (CNN, Fox News, and MSNBC), for shows aired from 5 PM until 11 PM eastern time, Monday through Friday. As highlighted yesterday, our analytical coverage varies by network, program, and date, but our intention is to augment it over time.

CHART 2: Slant Rating by Program - January 16 to 20, 2012

Content favoring the Republican party in Chart 2 is portrayed in red (numerically positive), while content that slants towards the Democratic Party is shown in blue (numerically negative). Those interested in the underpinnings of the Mediate Metrics slant rating system should review our January 31st post, or see our primer on Text Analytics Basics at: http://wp.me/p1MQsU-at.

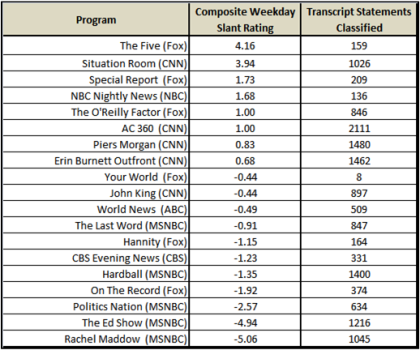
Since our analytical coverage varies by network, program, and date, so does the associated confidence factor in our slant ratings. The exact amount of coverage per network is shown in the Table 2 below, but we have graphically indicated depth-of-coverage by way of color shading in Chart 1. For example, the cones representing The Five, Hannity, and On The Record were purposely made lighter to reflect the relatively small transcript coverage for those particular networks. Low transcript coverage likely accounts for certain results that may seem counter-intuitive; we expect those metrics to adapt with volume and time.

TABLE 2: Slant by Program - January 16 to 20, 2012

As mentioned yesterday, we have partitioned statements about the Republican Presidential primaries, since they tend to be disproportionately negative and often lack inter-party comparison, and have largely excluded them from these slant ratings. Similarly, the Republican Presidential debates and other such dedicated program segments have been omitted in their entirety since they do not reflect the political positions of the networks, programs, or contributors under a consideration.

We’ll publish an “impact rating” for the same January 16 – 20 time period tomorrow.

Tagged , , , , , , , , , , , , , , , , ,