Tag Archives: liberal media bias

FLASH REPORT: Political Slant Ratings by Show – 1/30 to 2/3

Our latest TV News measurement metrics, targeting individual programs aired by the 3 major broadcast networks (ABC, CBS, and NBC) and the top 3 cable news channels (CNN, Fox News, and MSNBC), is fairly consistent with our previous studies.  As has been our pattern, we have limited our focus shows airing from 5 PM until 11 PM eastern time, Monday through Friday. Because of that, transcript coverage is less than normal since Florida primary coverage preempted several regular programs under study.

It’s worth noting that, particularly in the case of CNN, those special programs garnered Nielsen ratings of roughly twice the average of the programs they replaced (Erin Burnett Outfront & Anderson Cooper 360). For those who wonder why the media is obsessively covering the Republican primaries, your answer lies there.

CHART 1: Slant Rating by Show - January 30 to February 3

As always, content with a numerical rating above zero indicates a Republican slant, with ratings below zero representing a Democratic slant. In this case, however, those shows which are in the +2.0 to -2.0 range are shown in gray, indicating that they are in the “balanced” news category. The one notable exclusion this week is CBS Evening News, but our content coverage for it was exceptionally light. Red remains the color indicator for “slanted” news which favors the Republican party, while slanted content that favors towards the Democratic party is shown in blue. Those interested in the underpinnings of the Mediate Metrics slant rating system should review our January 31st post, or see our primer on Text Analytics Basics at: http://wp.me/p1MQsU-at.

Since our analytical coverage varies by program and date, so does our confidence in the associated show ratings. The exact amount of program coverage is shown in the Table 1 below, but we have graphically indicated depth-of-coverage by way of color shading in Chart 1. For example, the cones representing CBS Evening News, Special Report (Fox), and NBC Nightly News were purposely made lighter to reflect the relatively small transcript coverage for those particular show. We should also note that our version 1.4 classifier did exhibit some anomalies that caused our NBC Nightly News ratings to be disproportionately skewed towards favoring Republicans.

TABLE 1: Slant Rating by Show - January 30 to February 3

Further information about our rating system can be found in previous posts, or by contacting us via email at: barry@mediatemetrics.com

Tagged , , , , , , , , , , , , , , , , , , , , ,

LIBERAL MEDIA BIAS?: Impact Report #2 Provides the Answer(s)

Is there a liberal bias (or as we prefer to call it, political news slant) in the U.S media? It depends largely on which news content you think matters most.

Based on the data we currently have under analysis, early indications are that the leading broadcast and cable new outlets lean towards the Democratic party. With that said, the recently released Pew Research Center News Interest Index indicates that more people are now turning to cable news for information about the 2012 presidential campaign than to other forms of media. Adjusting for their findings yields an entirely different result.

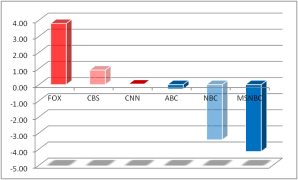
For Impact Report #2,  we have quantified the amount of network slant (aggregate speaker bias plus editorial influence) and combined it with viewership data in order to assess the total “Impact.” In this installment, we have computed the weighted-average Impact Rating for each network during the weeks of January 16th and January 23rd, focused on their evening/weekday news programming. The results are depicted below:

Aggregate Slant Impact: Weekdays - January 16 to 17

Aggregate Slant Impact: Weekdays - January 16 to 27

As in all of our charts, content favoring the Republican party is represented in red (greater than zero), while that which leans towards the Democratic Party is shown in blue (less than zero). We have indicated depth-of-coverage by lightening the base colors as required. For example, the bases representing NBC,CBS, and to a lesser degree Fox News, were purposely made lighter to reflect the limited transcript coverage for those particular networks. Regardless, the basic message depicted in chart above is that the slant rating base is amplified by the number of people viewing the content. The table below shows the numerical analysis supporting the chart:

The Cumulative Slant Ratings  in column 2 were derived from data previously discussed and shown at this site on Wednesday, February 8th. We have also factored in viewership data for the networks and programs under review. As you can see, the cumulative rating for this report — across all networks and programs we are studying —  slightly favors Democrats/Liberals, as indicated by the numbers highlighted in light blue.

If, however, we account for the Pew Research data, which states that 36% of people regularly go to cable networks to learn about Presidential campaigns (and, we presume, national political news in general) versus only 26% turning to national nightly news programs, our cumulative results shift in favor of Republican/conservative interests (as highlighted in light red).

Liberal or conservative media bias? It all depends on whose news one views.

Tagged , , , , , , , , , , , , , , ,

TREND REPORT #1: Political Bias by TV Network

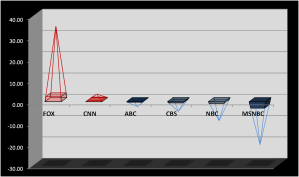
The chart at right summarizes the slant ratings for the networks we have thus far analyzed in January. Our previously published Flash Reports are useful snap shots, but the trend analysis better portrays the long-term political orientation of the networks, programs, and time periods we are studying.

The lines and markers in our graph represent the high/low/weighted average slant ratings for each network in our previous 2 weeks of analysis. Even with this relatively small data set, trends are beginning to emerge.

ABC has operated within a very tight range, as had CNN, indicating that they are quite purposeful about their political orientations — and none too slanted, either.

CBS and (especially) NBC have favored different parties each week, but our analytical databases are the lightest for those 2 networks. Their weighted averages currently favor the Democratic party (depicted in blue. with numerical ratings less than zero), but time will tell where they each level out at.

Not surprisingly, Fox News and MSNBC both show the largest partisan bias. Since Fox’s evening line-up does contain some “balanced” news programming (such as “Special Report with Bret Baier” and “The Fox Report with Shepard Smith”), the fact that their relative weighted slant rating is lower than MSNBC’s comes as no surprise. At some point, we may analyze the balanced news program category by itself to see how political messaging is interwoven within it.

Tomorrow, we will use this data as the basis for our weekly Impact Report to quantify the combined effects of bias and reach. As mentioned in previous posts, bias is not by itself determined by the number of media outlets delivering a slanted message. Rather, it is akin to the advertising concept of share of voice, in which the number of  ad impressions is combined with the total available inventory, as well as the size of the audience that is receiving it.

Tagged , , , , , , , , , , , , , , , ,

FLASH REPORT: Media Bias by Network – 1/23 to 1/27

Week 2 of our media bias/slant ratings, based on our new-and-improved version 1.2 classifier,  shows some consistencies and variances from our 1/16 – 20 report of last week.

CHART 1: Slant Ratings by Network - Jan. 23 to 27

NOTE: Net content favoring the Republican Party in Chart 2 is portrayed in red; net content favoring the Democratic Party is shown in blue.

CBS and NBC’s party slant ratings, in comparison to last week’s, actually flipped in both cases. This is not altogether surprising, given that content under analysis for those 2 networks is relatively light, and that the nightly news shows we evaluate for both are “straight” news programs. In contrast, the party alignments of Fox, CNN, ABC, and MSNBC remained consistent, week-to-week.

As noted last Monday, our transcript coverage varies by network, program, and date. Correspondingly, our rating confidence is directly proportional to the amount of transcript text available for classification.The exact amount of coverage per network is shown in the table to the right, but we have graphically indicated depth-of-coverage in Chart 1 by way of color shading. For example, the bars representing the slant ratings for both NBC and CBS were purposely made lighter to reflect the relatively small transcript coverage for those particular networks.

Mediate Metrics’ slant measurement system is currently focused on weekday transcripts from the national nightly news programs on the 3 major broadcast networks (ABC, CBS, and NBC), along with programming aired from 5 PM until 11 PM eastern time on top 3 cable news channels (CNN, Fox, and MSNBC). Compared to last week, coverage under analysis is significantly improved for ABC and NBC, but has decreased for CBS.

For those new to our site, the numerical slant ratings supporting the Chart 1 emanate from a custom text analysis “classifier,” built to extract statements of political slant from TV news transcripts. (For more on the underlying technology, see our post on Text Analytics Basics at: http://wp.me/p1MQsU-at.) We have trained our classifier to interpret political slant quite conservatively, conforming to strict guidelines for the sake of consistency and objectivity. As such, the ratings we present may be perceived as under-reporting the absolute slant of the actual content under review, but the appropriate way to view our ratings is as relative to similar programming.

To properly evaluate editorial content, we have concluded that the Republican presidential primaries and candidates are subject to intense scrutiny. Related news content tends to be disproportionately negative, and often times does not contain a clear inter-party comparison — an element we consider a crucial condition for the proper evaluation of political slant. As such, we have excluded statements about the Republican Presidential primaries and candidates from our slant ratings at this juncture, unless parallel references to the Democratic party are mentioned in parallel.

We’ll publish slant ratings by program for the same January 23 – 27 time period tomorrow.

Tagged , , , , , , , , , , , , , , , , , ,

Text Analytics Basics

Text analytics, also known as “text mining,” automates what people — researchers, writers, and all seekers of knowledge through the written word—have been doing for years[i]. Thanks to the power of the computer and advancements in the field of Natural Language Processing (NLP), interested parties can tap into the enormous amount of text-based data that is electronically archived, mining it for analysis and insight. In execution, text analytics involves a progression of linguistic and statistical techniques that identify concepts and patterns. When properly tuned, text analytics systems can efficiently extract meaning and relationships from large volumes of information.

To some degree, one can think of the process of text analytics as the evolution of the simple internet search function we use every day, but with added layers of complexity. Searching and ranking words, or even small phrases, is a relatively simple task. Extracting information from large combinations of words and punctuation — which may include elements of slang, humor, or sarcasm — is significantly more difficult. Still, text mining systems generally employ a number of layered techniques to extract meaningful units of information from unstructured text, including:

  • Word/Phrase Search Frequency Ranking – What words or “n-grams” appear most often.
  • Tokenization – Identification of distinct elements within a text.
  • Stemming – Identifying variants of word bases created by conjugation, case, pluralization, etc.
  • POS (Part of Speech) Tagging – Specifically identifying parts of speech.
  • Lexical Analysis – Reduction and statistical analysis of text and the words and multi-word terms it contains.
  • Syntactic Analysis – Evaluation of sequences of language elements, from words and punctuation, and ultimately mapping natural language into a set of grammatical patterns.

The purpose for all of this NLP processing is to compare those computational nuggets with classifications or “codings,” that trained experts have assigned to representative text samples. Interpreting language is an exceedingly complex endeavor, and one that computers and software cannot effectively do without being “trained.” As such, text classification systems are designed to compare human codings with the patterns that emerge from computational analysis, and then mimic the expert coders for all future input.

As you may expect, the quality of any custom text analysis system is largely determined by the quality of the human coders it is trained on. As such, strict rules must be enforced on the human coders, with the knowledge that software classification systems are very literal (think “Dr. Spock”). Still, once effective coding rules are established that result in discernible patterns, text analysis systems are incredibly fast and consistent. Advanced classification systems, like the one employed by Mediate Metrics, are also adaptive, constantly evolving with the ebb and flow of political issues and rhetoric.


[i] Much of the explanation contained herein was gleaned from Text Analytics Basics, Parts 1 & 2, by Seth Grimes. July 28, 2008. http://www.b-eye-network.com/view/8032.

Tagged , , , , , , , ,

Open Season on Journalists: Trump versus Todd

It seems like every time I turn around, some political figure is taking on a journalist. Here’s the latest installment, featuring a very edgy Donald Trump chastising Chuck Todd of MSNBC during his Daily Rundown Show this morning.

http://www.youtube.com/watch?v=MyVq-Vj9IlY

Wouldn’t you love to see focus group ratings during one of these exchanges?

My sense is that many political figures already have.

Tagged , , , , , , , , ,

Editorial Selection: Fox and MSNBC

Building on the theme of editorial selection and the news, I decided to once again use my “tag cloud” (most popular words) tool on evening and prime time broadcasts from Fox News and MSNBC on November 14th and 15th. As I highlighted yesterday, media outlets can broadcast but a tiny portion of the available news, so I decided to see what these 2 competitors decided to emphasize.

DISCLAIMER #1: I could not wait to get this out, so I’m sure I will be making additional edits and refinements.

DISCLAIMER #2: Tag clouds are not surgical instruments. That fact, combined with the knowledge that I manually culled words that did not directly relate to specific topics and messaging themes should tell the reader to view the following with a critical eye…. as you should with all interpretative journalism.

Which virtually all political news is.

Disclaimers aside, examining the content selection of Fox and MSNBC is like having box seats at a gun fight. It’s clear that MSNBC is putting Republican Presidential candidates under a microscope, taking pot shots at local Republican candidates whenever possible, and positioning themselves as the mouth-piece for the middle class. Similarly, Fox has President Obama and the 2012 election in the cross hairs, featuring topics that cast him or his administration in a negative light, with specific emphasis on job creation (or a lack thereof).

Those are the highlights — or low-lights, depending on your point of view — but there is more information in the clouds if you are willing to stare at them briefly …

**********************************************************************************************************************

MSNBC “TOP 25” TAG CLOUD:

  • Substantial Republican Primary/Candidate focus, with Herman CAIN (236 occurrences) still drawing the most attention, ROMNEY (82 occurrences) a distant second, and Perry (52 occurrences) in third.
  • Occupy Wall Street is a significant topic, as evidenced by the occurrence of the related tag words MOVEMENT, OCCUPY, and STREET. Why WALL did not make the top 25, I have no idea.
  • SCOTT is in the top 25 primarily due to parallel references to Republican governors Scott Walker (Wisconsin) and Scott Brown (Florida). Similarly, JOHN was also mentioned frequently in relation to Ohio governor John Kasich, but I removed that name because several other JOHNs were intermingled in the word count.
  • Frequent references to AMERICANS (and AMERICANS by default, since my tag cloud tool intermittently extracts root words in parallel) and the middle CLASS seems to represent a positioning theme for MSNBC
  • JUDGE generally shows up in 2 different contexts: 1.) The judge who let Penn State coach Sandusky out on reduced bail and; 2.) The impartiality Judges Scalia and Thomas related to the Supreme Court case on health care.
  • CASE shows up in several different contexts, again related to the tag cloud tools penchant to extract root words — ObamaCARE, HealthCARE, MediCARE, and are “they” sCAREd?

FOX “TOP 25” TAG CLOUD:

  • No references to the Republican Primary candidates by name in the Top 25 tag words. In contrast, PRESIDENT (65 occurrences) and OBAMA (42 occurrences) are the top 2 most popular tag words in the cloud. When viewed in relation to the MSNBC tag cloud, one cannot help but conclude that negative politics extends to these 2 networks.
  • Similar, but not exactly the same, thematic positioning around AMERICA, but not so much on CLASS.
  • BOOK was an area of focus mostly because of controversies surrounding Bill O’Reilly’s new book (“Killing Lincoln”), and Peter Schweizer’s book about alleged congressional insider trading.
  • A greater focus on activities in the SUPER COMMITTEE, and with question on whether a satisfactory DEAL can be made.
  • DEAL was also used in the context of favorable (and ethically questionable) deals made on IPOs and land, leveraging the insider trading immunity afforded to congressman.
  • CONGRESS was primarily used in 2 contexts: 1.) There were several CONGRESS persons on the prime time Fox News programs I analyzed, and; 2.) Numerable references were made along the lines of our “Do-nothing CONGRESS. ..”
  • ELECTION appeared primarily as part of 2 topics: 1.) Forward-looking statements related to the 2012 Presidential election, and; 2.) The fact that negative news related to Solyndra was allegedly throttled by administration officials.
  • FLORIDA made the top 25 based on Florida government officials on the shows whose transcripts I analyzed.
  • JOB and JOBS are in the top group because of a focus on the subject of job creation.
  • LEGAL is attached to either the constitutional rights that should or should not be afforded terrorists, as well as related to immigration issues.
  • The term SPEAKER rose to the top because of references and sound bites from House Speaker John Boehmer, as well as an interview with FORMER SPEAKER of the House Newt Gingrich.

**********************************************************************************************************************

If you would like to know more about the specific details of my process or the specific programs I included in this analysis, just email me at: barry@mediatemetrics.com.

Tagged , , , , , , , , , , , , , , , , , , , , , , ,

White Paper Excerpt: “Bias and Objectivity in the News Media”

I remain convinced that one can measure media bias electronically, at least to some extent, by examining the text of news broadcasts and objectively identifying the speaker’s personal value judgments. With that said, it is far more difficult to extract bias based on that content that is chosen to be aired. The following excerpt, taken from a 2004 white paper published by The Foundation for Critical Thinking titled, “How to Detect Media Bias and Propaganda” by Dr. Richard Paul and Dr. Linda Elder, explains this far more eloquently than I ever could.

Enjoy.

********************************************************************************************************************

The logic of constructing news stories is parallel to the logic of writing history. In both cases, for events covered, there is both a massive background of facts and a highly restricted amount of space to devote to those facts. The result in both cases is the same: 99.99999% of the “facts” are never mentioned at all (see Figure 1).

FIGURE 1

If objectivity or fairness in the construction of news stories is thought of as equivalent to presenting all the facts and only the facts (“All the news that’s fit to print”), objectivity and fairness is an illusion. No human knows more than a small percentage of the facts and it is not possible to present all the facts (even if one did know them). It isn’t even possible to present all the important facts, for many criteria compete for determining what is “important.” We must therefore always ask, “What has been left out of this article?” “What would I think if different facts had been highlighted here?” “What if this article had been written by those who hold a point of view opposite to the one embedded in the story as told?”

*****************************************************************************************************************
Amen.

Tagged , , , , , , , , , , , , , , , , , , , , , , , , , , ,

Who’s News? YOU Decide.

The more I study media bias, the more I realize that TV coverage flows (and often overflows) in certain directions because viewers vote with their eyeballs.

The blogosphere is crackling today with reports on the CBS internal memo which directed their debate moderators to devote fewer questions to Michelle Bachmann. The issue certainly has ignited the fanaterati. Don’t get me wrong; editorial selection bias is a very real phenomenon. Still, a thinking person should consider other possibilities.

So here is one: Perhaps we get a disproportionate amount of coverage on certain issues and people because they drive viewership. Combined with the extensive amount of news capacity that needs to be filled, media outlets are motivated to keep popular stories alive because lots of people are following them. As an unfortunate by-product, reporters and commentators fan the  flames over time by digging up all kinds of corner-cases, then sensationalizing them as “New Developments!” And that’s when we enter the realm of the absurd.

Circling back to the issue du jour, giving Michelle Bachmann more debate time does not make sense for the network in that context. It’s an inexact science, but it is a network executive’s job is to promote viewership … which drives ad revenue …which increases company profits, equity value, and personal paychecks.

It’s tempting to see a conspiracy here, and maybe there is one, but I think it is equally possible that this is just capitalism in action.

Tagged , , , , , , , , , , , , , , , , , , , , , ,

Political News: More Commonly Used Media Bias Techniques

Combing through news transcripts for bias indicators provides you with either unique insights or temporary insanity. Despite my questionable mental state, I’ve uncovered some subtler tricks-of-the-news-trade that I’d like to share with my readers.

Value Judgments: By definition, a value judgment is an assessment that reveals more about the values of the person making the assessment than about the reality of what is assessed. Value judgments can be either direct or projected.

Direct value judgments are often preceded with “I,” either explicitly or as understood. Examples are: “I don’t believe that …,” “that won’t work …” Projected value judgments are less obvious, but are used extensively by certain commentators and politicians. Speakers, often wrapping themselves in the flag or as the spokesperson for some popular group, stealthily project their personal opinions with statements like, “Americans won’t support…,”or  “People are not going to …” It doesn’t jump out at you, but the speaker is putting their view in someone else’s mouth.

Loaded Questions and Leading Questions:  A program anchor is in a position of power to determining how the news is presented while viewers sit passively, accepting that the commentator is objectively informing and moderating discussions based on years of conditioning. In the modern era of news programming that is often not the case. Dialogs are rife with loaded and leading questions.

The popular definition of a loaded question is one which contains as controversial assumption but, for the purposes of semantically evaluating bias, my definition is that it is one that contains indisputable evidence of bias. It gives a strong indication of how an anchor wants his/her respondent to answer. Guidelines for recognizing loaded questions include:

  • Embedded value-judgments by the questioner: “Don’t you think that sounds <odd/wrong/funny/strange>”?
  • Multiple questions within the same statement: “Who would support…?”, “What is the thinking….?”, “Where did they get…?”, “When …?”, “Why …?”

Leading questions are usually more subtle, and don’t have the clear indicators of loaded questions. Still, a savvy viewer can generally pick them out instinctively, particularly when considered together with succeeding responses. For the most part, news programs conform to the cardinal rule of litigation: Don’t ask a question if you don’t know how it will be answered. In the information age, commentators are rarely uninformed about the positions of their guests. In fact, most of them are regulars.

Once you are aware of these rhetorical devices, you’ll be surprised how often you will notice them while watching, “The News.”

Tagged , , , , , , , , , , , , , , , ,